plot ridgeline density plot
Usage
plotridge(data, lv = NULL, indexx = NULL, indexy = NULL, ...)
Arguments
- data
matrix
- lv
factor vector for the column
- indexx
index for matrix row
- indexy
index for matrix column
- ...
parameters for `title` function
Value
ridgeline density plot
Examples
data(list)
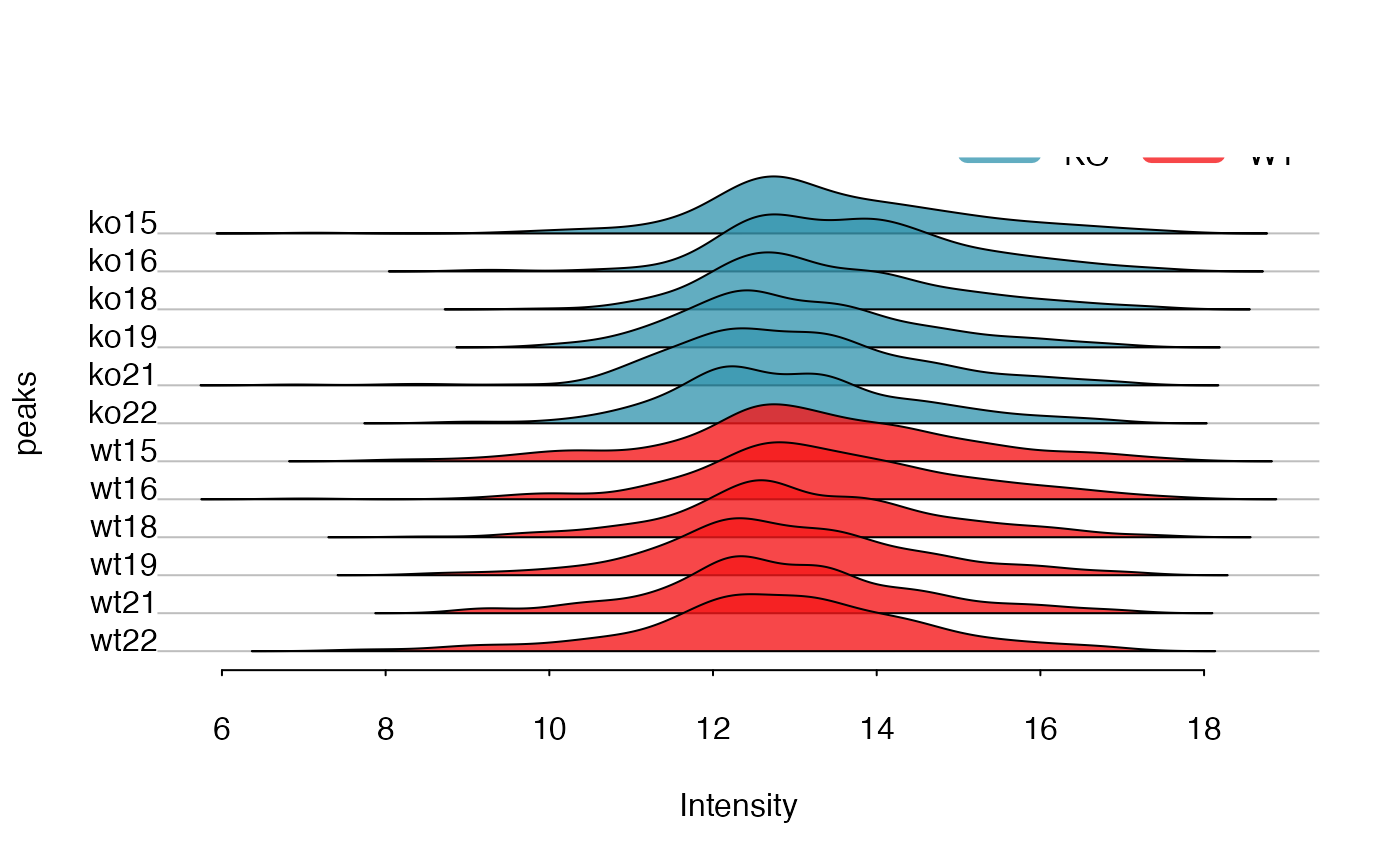
plotridge(t(list$data),indexy=c(1:10),xlab = 'Intensity',ylab = 'peaks')
 plotridge(log(list$data),as.factor(list$group$sample_group),xlab = 'Intensity',ylab = 'peaks')