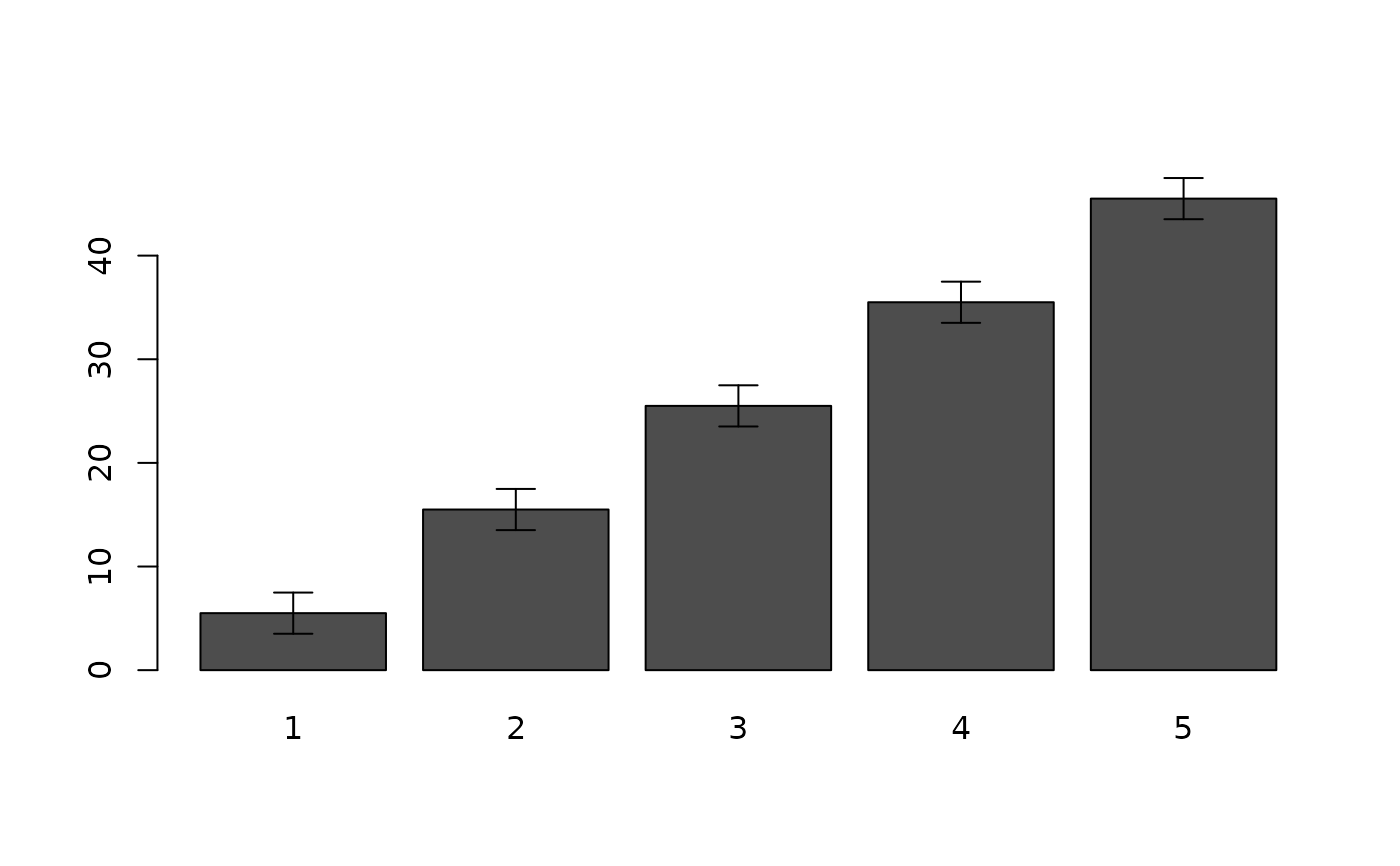
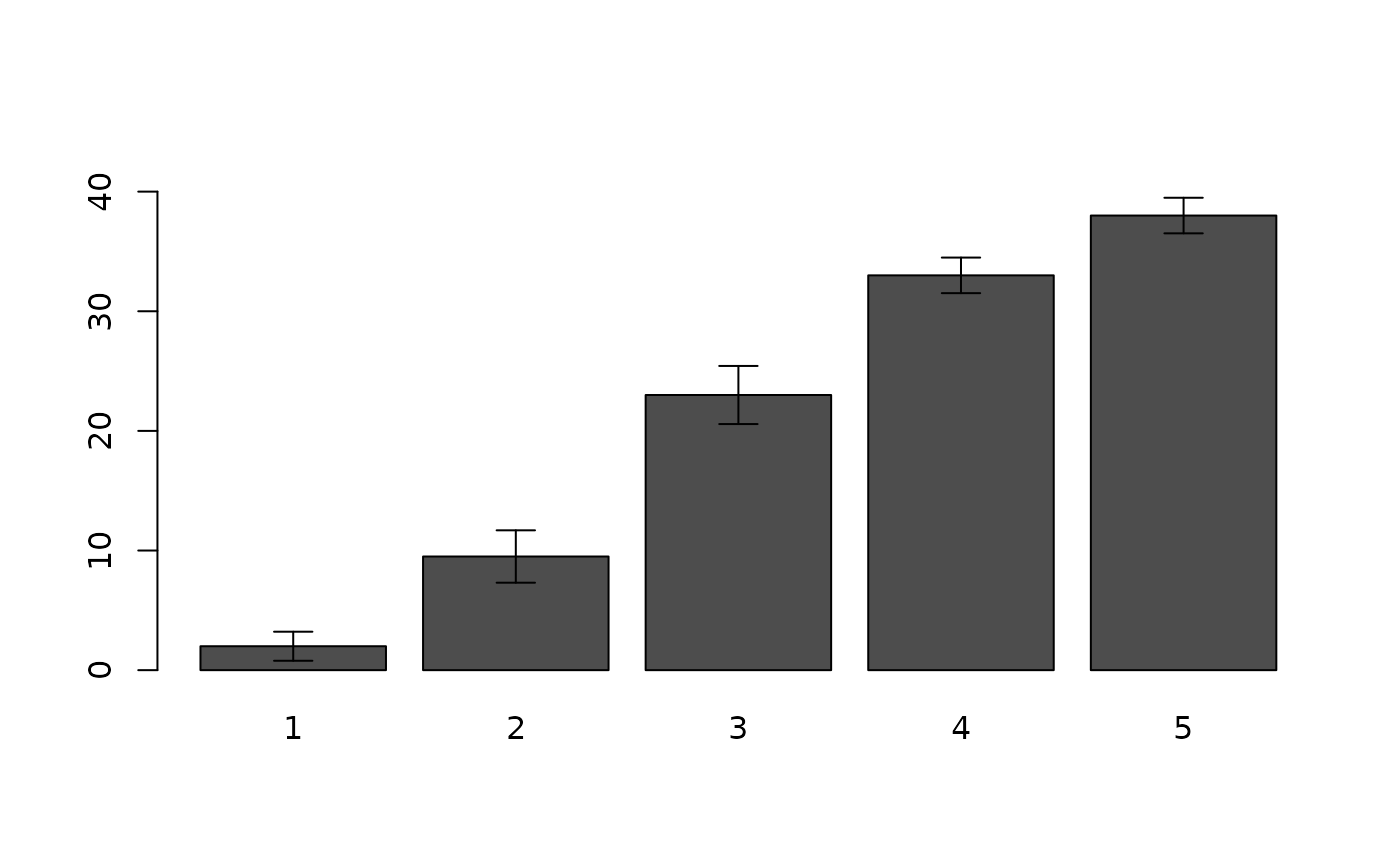
Show the upper or lower confidence interval of Gabriel's barplot.
Details
As shown in Gabriel's paper,use M(alpha,k*,v), the upper alpha point of the Studentized Maximum Modulus of k* normals and v df. And this method is a graphical way for visually mutiple comparision.
References
Gabriel, K.R., 1978. A Simple Method of Multiple Comparisons of Means. Journal of the American Statistical Association 73, 724.
Stoline, M.R., Ury, H.K., 1979. Tables of the Studentized Maximum Modulus Distribution and an Application to Multiple Comparisons among Means. Technometrics 21, 87.