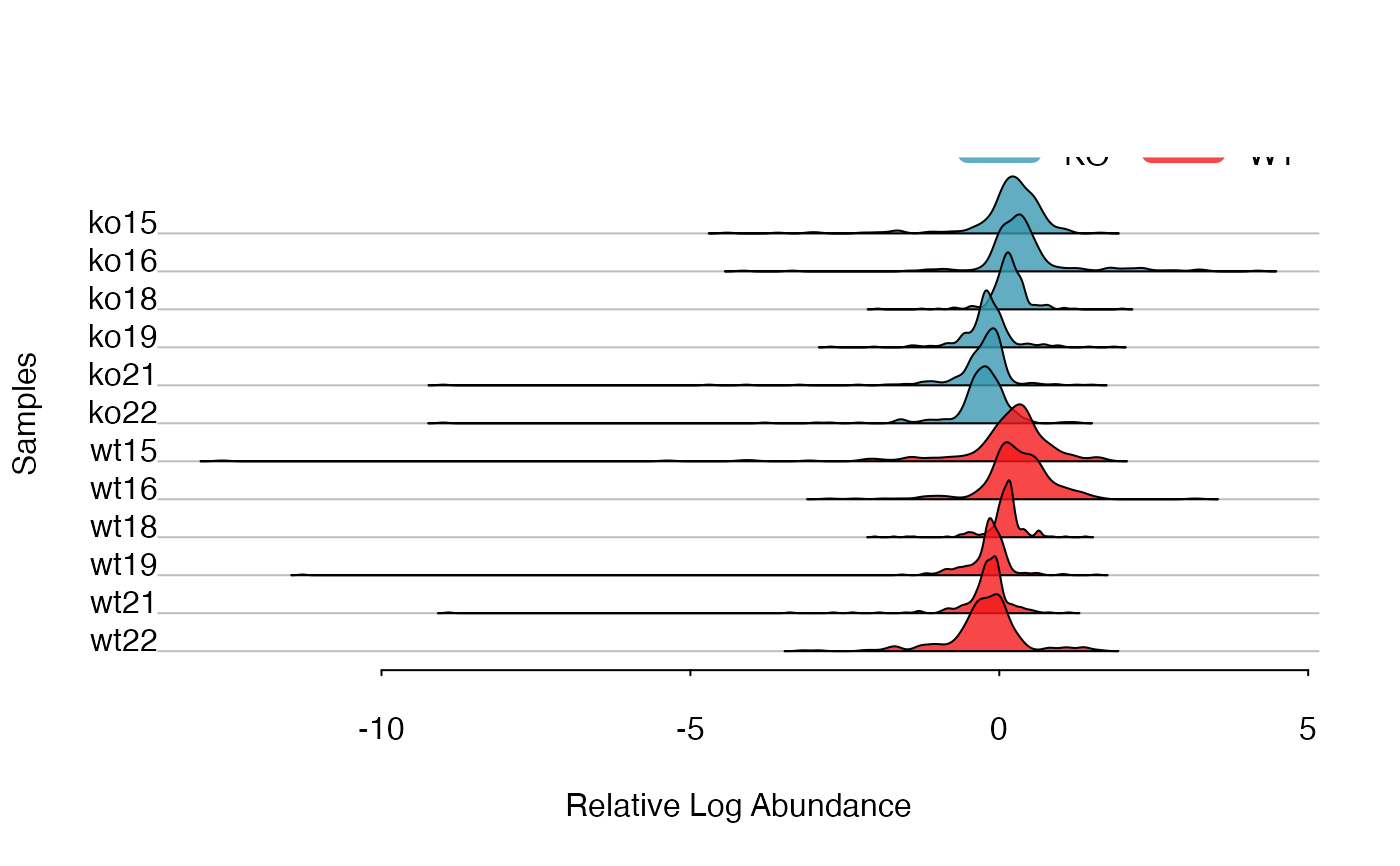
Relative Log Abundance Ridge (RLAR) plots for samples or peaks
Usage
plotridges(data, lv, type = "g")
Arguments
- data
data row as peaks and column as samples
- lv
factor vector for the group information of samples
- type
'g' means group median based, other means all samples median based.
Value
Relative Log Abundance Ridge(RLA) plots
Examples
data(list)
plotridges(list$data, as.factor(list$group$sample_group))