Network Analysis for Exposomics Study
exposomics.Rmd
library(enet)
library(igraph)
#>
#> Attaching package: 'igraph'
#> The following objects are masked from 'package:stats':
#>
#>     decompose, spectrum
#> The following object is masked from 'package:base':
#>
#>     union
library(ggnetwork)
#> Loading required package: ggplot2
library(genefilter)
data("asthma")
data("expo")
data("meta")
Introduction
Exposomics study try to evaluate the totality of human environmental exposures on health conditions. It’s not only involved in multiple exposures and multiple health outcomes, but also need other omics studies to support the relationships between exposures and health outcomes. Network analysis should be one of the best choices to describe relationship among omics. The purpose of enet package is to provide the tools to visualize network and extract certain structures for exposomics. The first application is gatekeeper discovery.
Gatekeeper
Gatekeeper is defined as the molecular with has a mediation role between exposure(s) and other molecular. The association between gatekeepers and exposures could be generated from linear regression or other machine learning algorithms. The relationships among molecular could be built on correlation network analysis. However, as long as certain statistics could be used to describe relationship among molecular or between molecular and exposures, it’s should be fine to use such concept.
Here we will use a subset data from Exposome Data Challenge 2021 for demonstration purpose. The details of this dataset can be found online. Here we will use 177 serum metabolites as the mediation between 7 selected exposures and health outcome(asthma or not) from 1198 samples.
Check correlation among metabolites
The first step of Gatekeeper is to find the active metabolites. Here we defined active metabolites as the metabolites associated with other metabolites. If a metabolite is not associated with any other metabolites, it’s hard to say such a molecular is active in the bio-system.
Then we need to define the association among metabolites. A intuitively association is correlation. If two metabolites are correlated, they might play role in certain biological pathway. If multiple metabolites are correlated as a network, those metabolites should be in one active pathway. Here we can check such correlation network in our demo data.
mnets <- getmmnet(exp(meta))
#> 9 metabolites correlation network clusters found
#> 155 out of 177 metabolites have no correlation with other metabolites
net <- graph_from_data_frame(mnets$net,directed = F)
V(net)$membership <- components(net)$membership
n <- ggnetwork(net)
ggplot(n, aes(x = x, y = y, xend = xend, yend = yend)) +
  geom_edges(color = "grey50",size=0.7) +
  geom_nodes(aes(color = as.factor(membership))) +
  guides(color=F,size=F) +
  ggtitle('Serum Metabolites network') +
  theme_blank()
#> Warning: `guides(<scale> = FALSE)` is deprecated. Please use `guides(<scale> =
#> "none")` instead.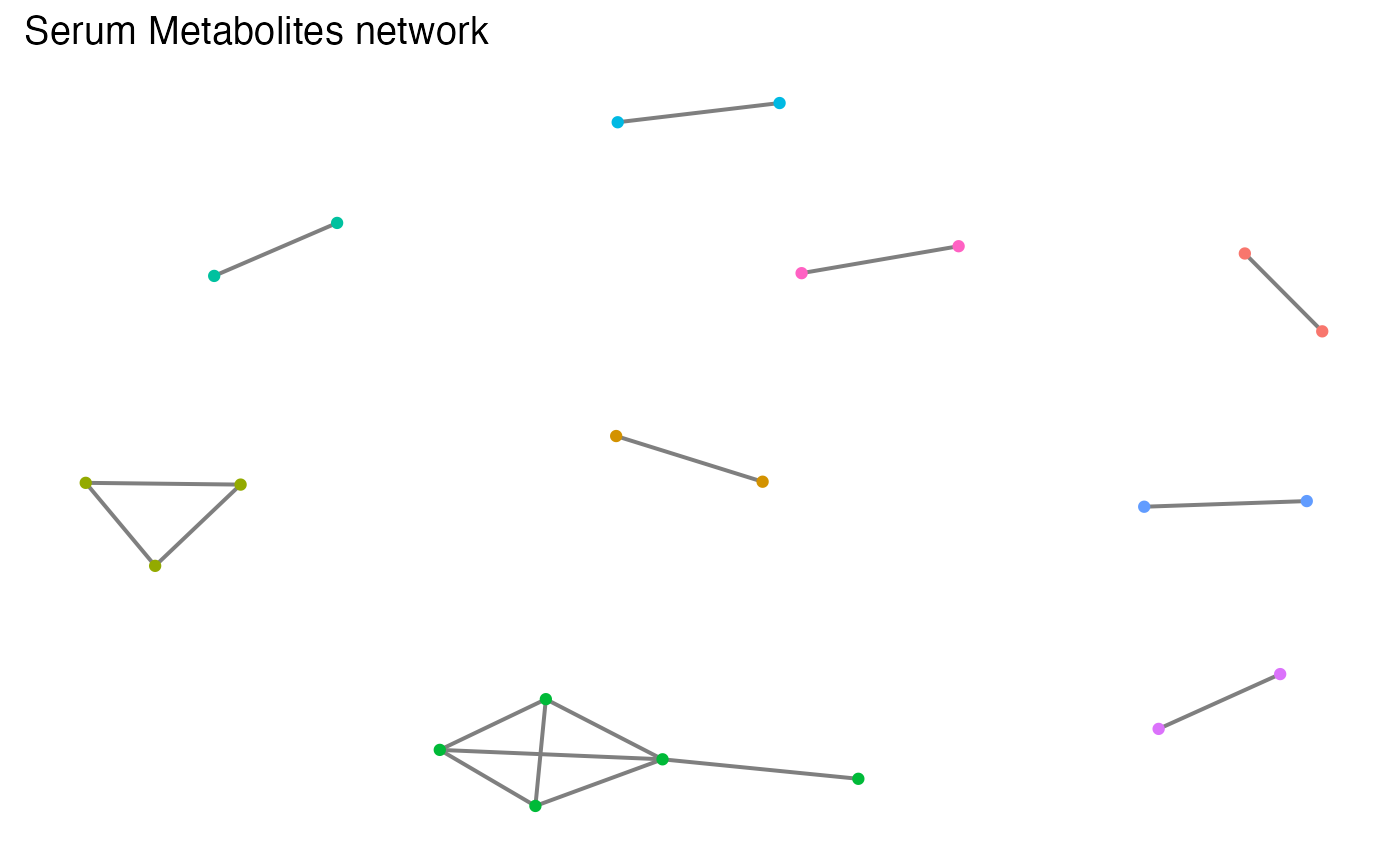
Here we could find 9 metabolites correlation network clusters.
Correlation coefficient cutoff selection
Correlation coefficient cutoff could also be selected by the data. If the cutoff is too small, all the metabolites will be connected as one cluster. However, if the cutoff is too high, only a few metabolites can be used for further discussion and loss information. In this case, the metabolites cluster number will increase and then decrease. Here, we developed a function to find the cutoff based on the data with largest numbers of clusters.
cutoff <- getcf(t(exp(meta)))
#> 1 correlation network clusters found
#> 0 out of 177 featuers have no correlation with other featuers
#> 1 correlation network clusters found
#> 0 out of 177 featuers have no correlation with other featuers
#> 1 correlation network clusters found
#> 0 out of 177 featuers have no correlation with other featuers
#> 1 correlation network clusters found
#> 0 out of 177 featuers have no correlation with other featuers
#> 1 correlation network clusters found
#> 0 out of 177 featuers have no correlation with other featuers
#> 1 correlation network clusters found
#> 0 out of 177 featuers have no correlation with other featuers
#> 1 correlation network clusters found
#> 0 out of 177 featuers have no correlation with other featuers
#> 1 correlation network clusters found
#> 0 out of 177 featuers have no correlation with other featuers
#> 1 correlation network clusters found
#> 1 out of 177 featuers have no correlation with other featuers
#> 1 correlation network clusters found
#> 2 out of 177 featuers have no correlation with other featuers
#> 1 correlation network clusters found
#> 2 out of 177 featuers have no correlation with other featuers
#> 1 correlation network clusters found
#> 3 out of 177 featuers have no correlation with other featuers
#> 1 correlation network clusters found
#> 3 out of 177 featuers have no correlation with other featuers
#> 1 correlation network clusters found
#> 3 out of 177 featuers have no correlation with other featuers
#> 1 correlation network clusters found
#> 4 out of 177 featuers have no correlation with other featuers
#> 1 correlation network clusters found
#> 4 out of 177 featuers have no correlation with other featuers
#> 1 correlation network clusters found
#> 4 out of 177 featuers have no correlation with other featuers
#> 1 correlation network clusters found
#> 6 out of 177 featuers have no correlation with other featuers
#> 1 correlation network clusters found
#> 8 out of 177 featuers have no correlation with other featuers
#> 1 correlation network clusters found
#> 9 out of 177 featuers have no correlation with other featuers
#> 1 correlation network clusters found
#> 11 out of 177 featuers have no correlation with other featuers
#> 1 correlation network clusters found
#> 14 out of 177 featuers have no correlation with other featuers
#> 1 correlation network clusters found
#> 15 out of 177 featuers have no correlation with other featuers
#> 2 correlation network clusters found
#> 16 out of 177 featuers have no correlation with other featuers
#> 3 correlation network clusters found
#> 18 out of 177 featuers have no correlation with other featuers
#> 4 correlation network clusters found
#> 20 out of 177 featuers have no correlation with other featuers
#> 5 correlation network clusters found
#> 21 out of 177 featuers have no correlation with other featuers
#> 6 correlation network clusters found
#> 23 out of 177 featuers have no correlation with other featuers
#> 6 correlation network clusters found
#> 26 out of 177 featuers have no correlation with other featuers
#> 8 correlation network clusters found
#> 30 out of 177 featuers have no correlation with other featuers
#> 7 correlation network clusters found
#> 35 out of 177 featuers have no correlation with other featuers
#> 7 correlation network clusters found
#> 37 out of 177 featuers have no correlation with other featuers
#> 6 correlation network clusters found
#> 41 out of 177 featuers have no correlation with other featuers
#> 7 correlation network clusters found
#> 44 out of 177 featuers have no correlation with other featuers
#> 5 correlation network clusters found
#> 49 out of 177 featuers have no correlation with other featuers
#> 8 correlation network clusters found
#> 53 out of 177 featuers have no correlation with other featuers
#> 10 correlation network clusters found
#> 58 out of 177 featuers have no correlation with other featuers
#> 13 correlation network clusters found
#> 66 out of 177 featuers have no correlation with other featuers
#> 15 correlation network clusters found
#> 72 out of 177 featuers have no correlation with other featuers
#> 15 correlation network clusters found
#> 79 out of 177 featuers have no correlation with other featuers
#> 20 correlation network clusters found
#> 95 out of 177 featuers have no correlation with other featuers
#> 20 correlation network clusters found
#> 108 out of 177 featuers have no correlation with other featuers
#> 20 correlation network clusters found
#> 113 out of 177 featuers have no correlation with other featuers
#> 20 correlation network clusters found
#> 127 out of 177 featuers have no correlation with other featuers
#> 17 correlation network clusters found
#> 137 out of 177 featuers have no correlation with other featuers
#> 9 correlation network clusters found
#> 155 out of 177 featuers have no correlation with other featuers
#> 6 correlation network clusters found
#> 162 out of 177 featuers have no correlation with other featuers
#> 3 correlation network clusters found
#> 171 out of 177 featuers have no correlation with other featuers
#> 2 correlation network clusters found
#> 173 out of 177 featuers have no correlation with other featuers
#> 0 correlation network clusters found
#> 177 out of 177 featuers have no correlation with other featuers
#> 0 correlation network clusters found
#> 177 out of 177 featuers have no correlation with other featuers
#> 0.8 is selected as correlation cutoff.
plot(cutoff$nc~cutoff$np,xlab = 'metabolites numbers',ylab = 'cluster numbers',type='o')
# use the selected cutoff to find active metabolites
mnets <- getmmnet(exp(meta),cutoff = cutoff$cutoff)
#> 20 metabolites correlation network clusters found
#> 95 out of 177 metabolites have no correlation with other metabolites
net <- graph_from_data_frame(mnets$net,directed = F)
V(net)$membership <- components(net)$membership
n <- ggnetwork(net)
ggplot(n, aes(x = x, y = y, xend = xend, yend = yend)) +
  geom_edges(color = "grey50",size=0.7) +
  geom_nodes(aes(color = as.factor(membership))) +
  guides(color=F,size=F) +
  ggtitle('Serum Metabolites network') +
  theme_blank()
#> Warning: `guides(<scale> = FALSE)` is deprecated. Please use `guides(<scale> =
#> "none")` instead.
Check association between paired metabolite and exposure
re <- getgk(exp(meta),expo)
#> 9 metabolites correlation network clusters found
#> 155 out of 177 metabolites have no correlation with other metabolites
#> 18 peaks were involved.
#> 14 peaks could be gatekeepers.
Here we can find most of the metabolites are associated with multiple exposures and 14 of those metabolites can be defined as gatekeepers. The returned object is a list with three elements: me contains the table of associated metabolites and exposures, data contains a list with every gatekeepers’ network and metaexp contain the networks of all of the gatekeepers.
# check the table
re$me
#>
#>                      hs_as_c_Log2 hs_co_c_Log2 hs_cs_c_Log2 hs_cu_c_Log2
#>   log.C10                       1            0            1            0
#>   log.C14.1                     0            0            1            0
#>   log.C16.1                     1            0            1            0
#>   log.C8                        1            0            1            0
#>   log.Ile                       0            0            0            1
#>   log.Leu                       0            0            1            1
#>   log.lysoPC.a.C24.0            0            0            1            0
#>   log.lysoPC.a.C28.1            0            0            1            0
#>   log.PC.aa.C38.6               1            1            1            1
#>   log.PC.aa.C40.6               1            1            1            1
#>   log.PC.ae.C38.5               0            0            1            0
#>   log.SM.C18.0                  0            0            1            0
#>   log.SM.C18.1                  0            0            1            0
#>   log.Val                       0            0            1            1
#>
#>                      hs_sumDEHP_cadj_Log2 hs_sumPCBs5_cadj_Log2
#>   log.C10                               0                     0
#>   log.C14.1                             1                     1
#>   log.C16.1                             1                     1
#>   log.C8                                0                     0
#>   log.Ile                               0                     0
#>   log.Leu                               0                     0
#>   log.lysoPC.a.C24.0                    1                     0
#>   log.lysoPC.a.C28.1                    1                     0
#>   log.PC.aa.C38.6                       1                     1
#>   log.PC.aa.C40.6                       1                     1
#>   log.PC.ae.C38.5                       0                     1
#>   log.SM.C18.0                          1                     0
#>   log.SM.C18.1                          1                     0
#>   log.Val                               0                     0
# check the individual network
n <- ggnetwork(re$data[[1]])
ggplot(n, aes(x = x, y = y, xend = xend, yend = yend)) +
  geom_edges(color = "grey50",size=0.7) +
  guides(color=F,size=F) +
  ggtitle('Gatekeeper network') +
  theme_blank()
#> Warning: `guides(<scale> = FALSE)` is deprecated. Please use `guides(<scale> =
#> "none")` instead.
# check the network for all gatekeeper
n <- ggnetwork(re$metaexp)
ggplot(n, aes(x = x, y = y, xend = xend, yend = yend)) +
  geom_edges(color = "grey50",size=0.7) +
  geom_nodes(aes(size = ifelse(vertex.names %in% colnames(re$me),0,1))) +
  guides(color=F,size=F) +
  ggtitle('Gatekeepers network') +
  theme_blank()
#> Warning: `guides(<scale> = FALSE)` is deprecated. Please use `guides(<scale> =
#> "none")` instead.
Check association between gatekeepers and health outcome
metagk <- meta[match(rownames(re$me),rownames(meta)),]
re2 <- rowttests(metagk,factor(asthma))
re2
#>                     statistic           dm    p.value
#> log.C10             1.8753954  0.066032691 0.06098182
#> log.C14.1           2.5633914  0.145761799 0.01048693
#> log.C16.1           1.8361402  0.047445761 0.06658503
#> log.C8              1.3609328  0.034279370 0.17379130
#> log.Ile             1.7728963  0.066225737 0.07650037
#> log.Leu             1.5129675  0.051428112 0.13055211
#> log.lysoPC.a.C24.0  0.4656238  0.016894581 0.64156955
#> log.lysoPC.a.C28.1  0.6649800  0.023563895 0.50619149
#> log.PC.aa.C38.6     0.3396100  0.012525738 0.73420991
#> log.PC.aa.C40.6    -0.2529167 -0.009685914 0.80037608
#> log.PC.ae.C38.5     2.0828567  0.053962709 0.03747632
#> log.SM.C18.0        0.8211743  0.020921923 0.41171065
#> log.SM.C18.1        0.7766756  0.019275111 0.43750374
#> log.Val             2.2236925  0.060544251 0.02635536
Here we can find two gatekeepers might mediate the influences from multiple exposures to asthma condition.