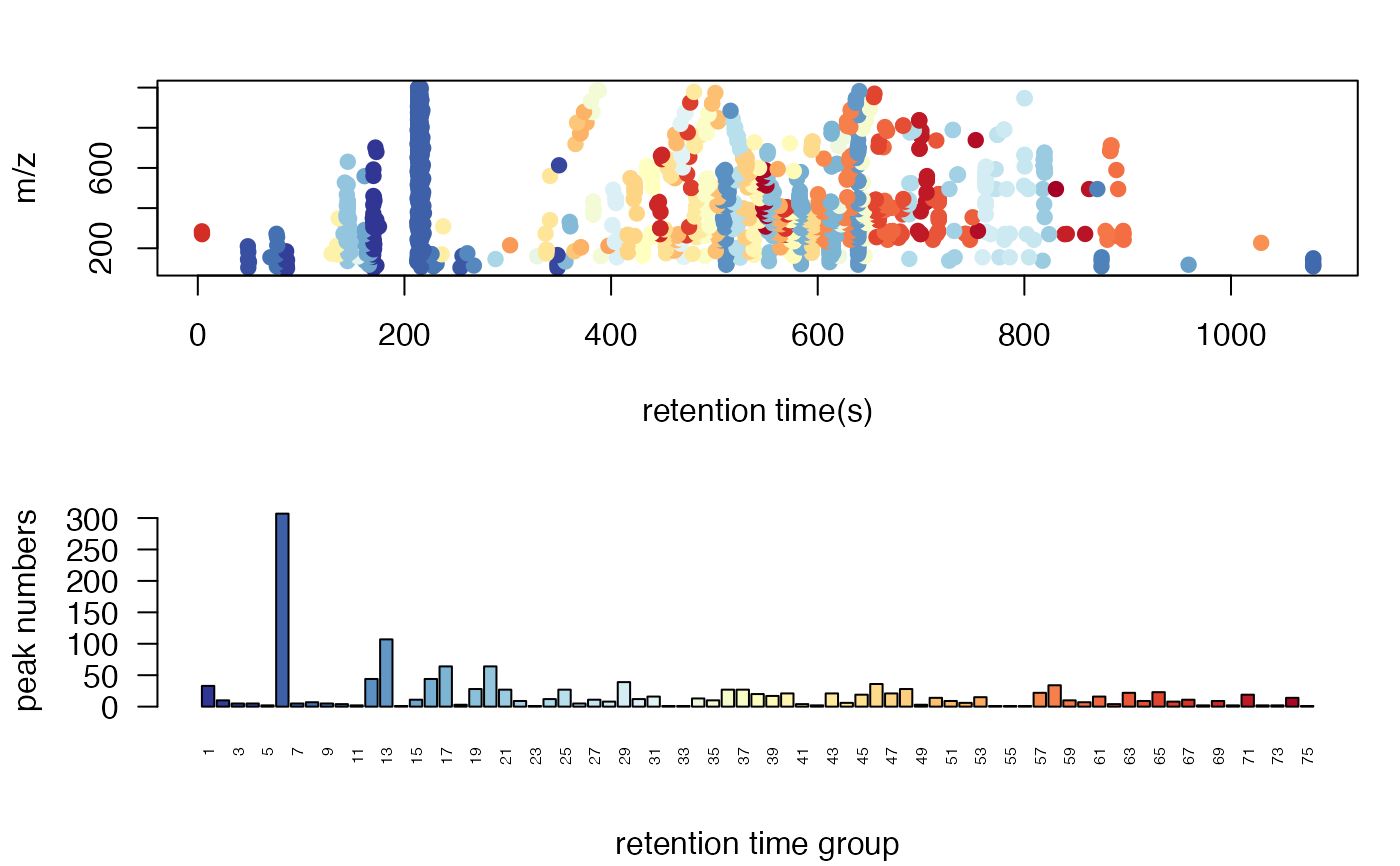
Plot the retention time group
plotrtg(list, ...)Examples
data(spmeinvivo)
pmd <- getpaired(spmeinvivo)
#> 75 retention time clusters found.
#> Using ng = 15
#> 5 unique PMDs retained.
#> The unique within RT clusters high frequency PMD(s) is(are)  28.03 21.98 44.03 17.03 18.01.
#> 409 isotope peaks found.
#> 109 multiple charged isotope peaks found.
#> 4 multiple charged peaks found.
#> 346 paired peaks found.
plotrtg(pmd)