Plot the std mass from GlobalStd algorithm in structure directed analysis(SDA) groups
Source:R/pmdvis.R
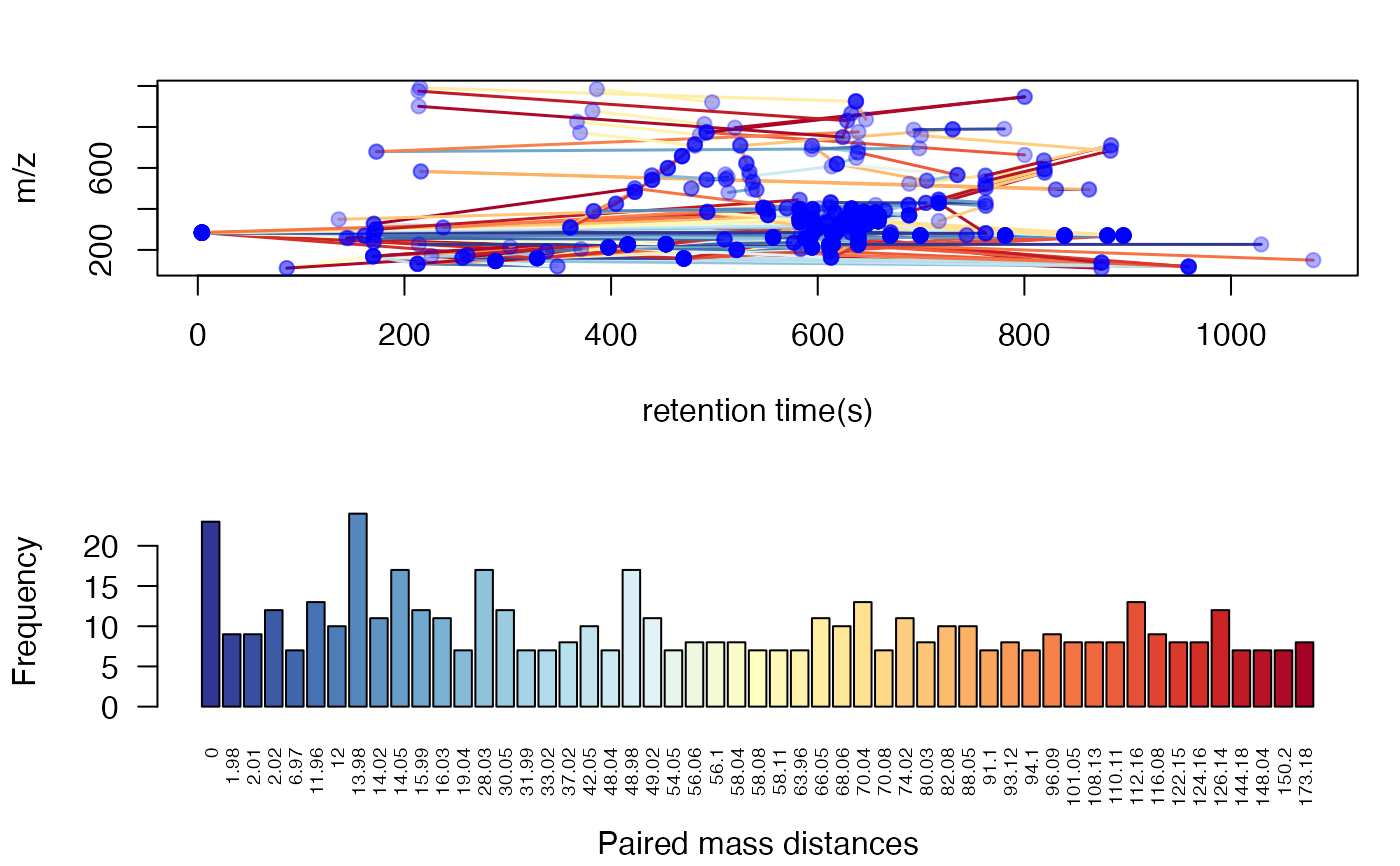
plotstdsda.RdPlot the std mass from GlobalStd algorithm in structure directed analysis(SDA) groups
plotstdsda(list, index = NULL, ...)Arguments
See also
Examples
data(spmeinvivo)
re <- globalstd(spmeinvivo, sda=TRUE)
#> 75 retention time clusters found.
#> Using ng = 15
#> 5 unique PMDs retained.
#> The unique within RT clusters high frequency PMD(s) is(are)  28.03 21.98 44.03 17.03 18.01.
#> 409 isotope peaks found.
#> 109 multiple charged isotope peaks found.
#> 4 multiple charged peaks found.
#> 346 paired peaks found.
#> 8 group(s) have single peaks 14 23 32 33 54 55 56 75
#> 11 group(s) with multiple peaks while no isotope/paired relationship 4 5 7 8 11 ... 42 49 68 72 73
#> 9 group(s) with isotope without paired relationship 2 9 22 26 52 62 64 66 70
#> 4 group(s) with paired without isotope relationship 1 10 15 18
#> 43 group(s) with both paired and isotope relationship 3 6 12 13 16 ... 65 67 69 71 74
#> 291 standard masses identified.
#> PMD frequency cutoff is 6 by PMD network analysis with largest network average distance 6.67 .
#> 53 groups were found as high frequency PMD group.
#> 0 was found as high frequency PMD.
#> 1.98 was found as high frequency PMD.
#> 2.01 was found as high frequency PMD.
#> 2.02 was found as high frequency PMD.
#> 6.97 was found as high frequency PMD.
#> 11.96 was found as high frequency PMD.
#> 12 was found as high frequency PMD.
#> 13.98 was found as high frequency PMD.
#> 14.02 was found as high frequency PMD.
#> 14.05 was found as high frequency PMD.
#> 15.99 was found as high frequency PMD.
#> 16.03 was found as high frequency PMD.
#> 19.04 was found as high frequency PMD.
#> 28.03 was found as high frequency PMD.
#> 30.05 was found as high frequency PMD.
#> 31.99 was found as high frequency PMD.
#> 33.02 was found as high frequency PMD.
#> 37.02 was found as high frequency PMD.
#> 42.05 was found as high frequency PMD.
#> 48.04 was found as high frequency PMD.
#> 48.98 was found as high frequency PMD.
#> 49.02 was found as high frequency PMD.
#> 54.05 was found as high frequency PMD.
#> 56.06 was found as high frequency PMD.
#> 56.1 was found as high frequency PMD.
#> 58.04 was found as high frequency PMD.
#> 58.08 was found as high frequency PMD.
#> 58.11 was found as high frequency PMD.
#> 63.96 was found as high frequency PMD.
#> 66.05 was found as high frequency PMD.
#> 68.06 was found as high frequency PMD.
#> 70.04 was found as high frequency PMD.
#> 70.08 was found as high frequency PMD.
#> 74.02 was found as high frequency PMD.
#> 80.03 was found as high frequency PMD.
#> 82.08 was found as high frequency PMD.
#> 88.05 was found as high frequency PMD.
#> 91.1 was found as high frequency PMD.
#> 93.12 was found as high frequency PMD.
#> 94.1 was found as high frequency PMD.
#> 96.09 was found as high frequency PMD.
#> 101.05 was found as high frequency PMD.
#> 108.13 was found as high frequency PMD.
#> 110.11 was found as high frequency PMD.
#> 112.16 was found as high frequency PMD.
#> 116.08 was found as high frequency PMD.
#> 122.15 was found as high frequency PMD.
#> 124.16 was found as high frequency PMD.
#> 126.14 was found as high frequency PMD.
#> 144.18 was found as high frequency PMD.
#> 148.04 was found as high frequency PMD.
#> 150.2 was found as high frequency PMD.
#> 173.18 was found as high frequency PMD.
plotstdsda(re)