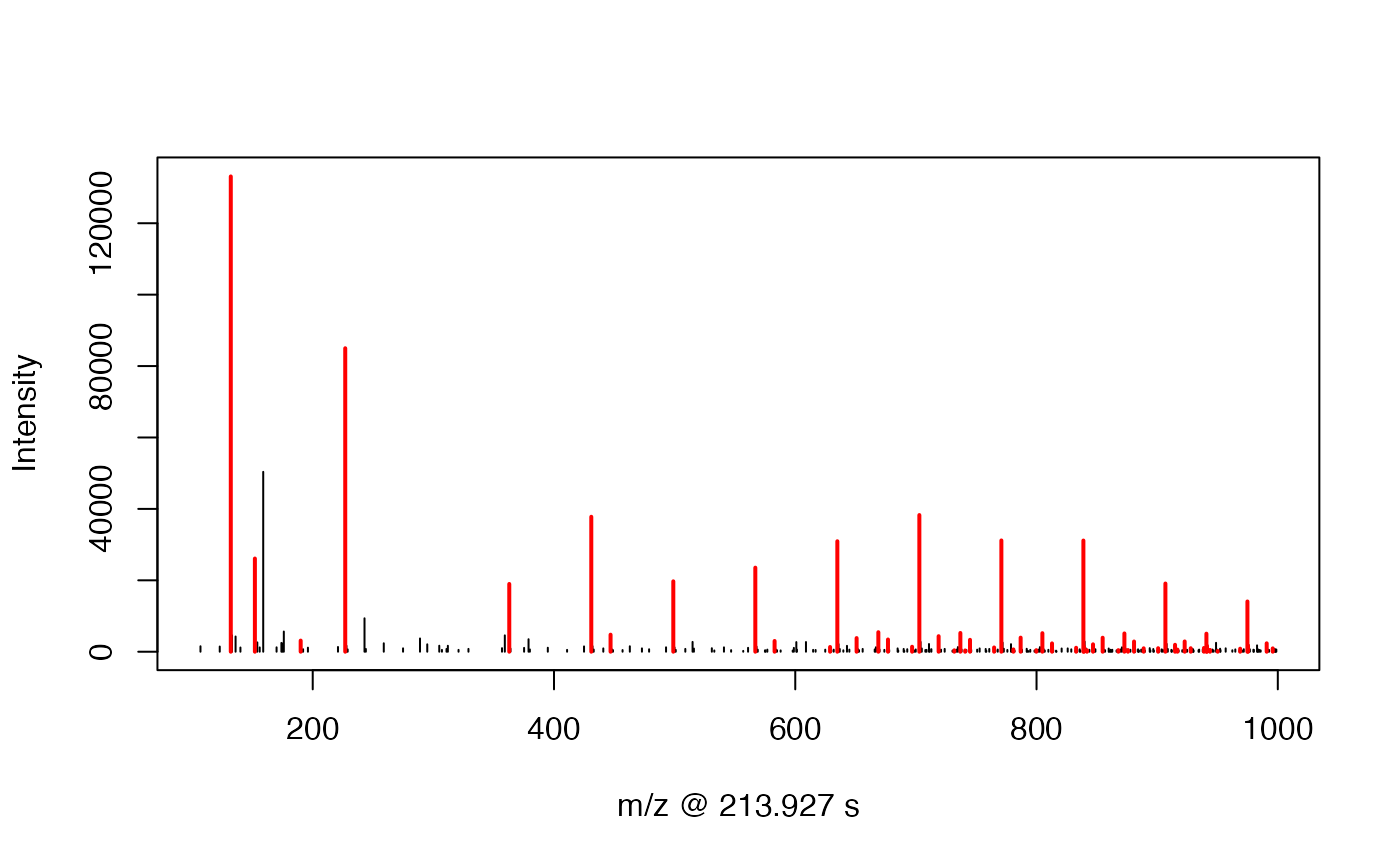
Plot the std mass from GlobalStd algorithm in certain retention time groups
Source:R/pmdvis.R
plotstdrt.RdPlot the std mass from GlobalStd algorithm in certain retention time groups
plotstdrt(list, rtcluster, ...)Arguments
See also
Examples
data(spmeinvivo)
pmd <- getpaired(spmeinvivo)
#> 75 retention time clusters found.
#> Using ng = 15
#> 5 unique PMDs retained.
#> The unique within RT clusters high frequency PMD(s) is(are)  28.03 21.98 44.03 17.03 18.01.
#> 409 isotope peaks found.
#> 109 multiple charged isotope peaks found.
#> 4 multiple charged peaks found.
#> 346 paired peaks found.
std <- getstd(pmd)
#> 8 group(s) have single peaks 14 23 32 33 54 55 56 75
#> 11 group(s) with multiple peaks while no isotope/paired relationship 4 5 7 8 11 ... 42 49 68 72 73
#> 9 group(s) with isotope without paired relationship 2 9 22 26 52 62 64 66 70
#> 4 group(s) with paired without isotope relationship 1 10 15 18
#> 43 group(s) with both paired and isotope relationship 3 6 12 13 16 ... 65 67 69 71 74
#> 291 standard masses identified.
plotstdrt(std,rtcluster = 6)